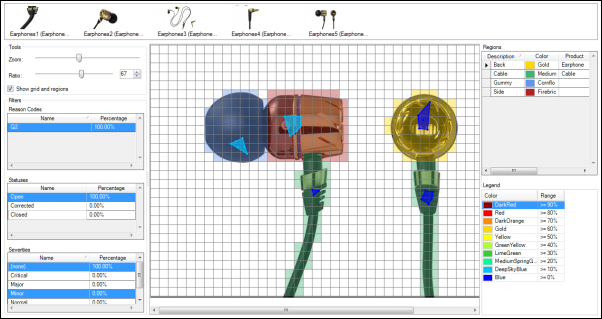
The Concentration Diagram shows the percentage of Visual Defect occurrences on all Product and Product Group images grouped by image region. The diagram displays parent images along with their child images provided that these child images have Visual Defects which apply to the Concentration Diagram criteria reported on them. The concentration is highlighted with different colors.
Choose the image for which you want to display the Concentration Diagram
(child images are also displayed provided that they have Visual Defects
reported on them. The number of Visual Quality Defects reported on a given
image is displayed in the brackets next to its name. If the name of the
image is too long to be displayed, you can hover the cursor over the image
to display a tooltip with the full name.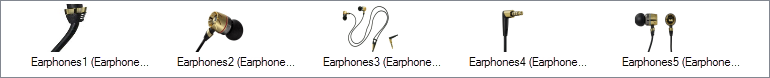
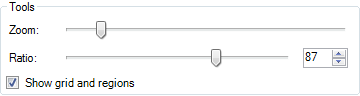
To zoom in on or zoom out of the image to display it in the most convenient way, use the Zoom slider
The Ratio is used for grouping Visual Quality Defects on the image to see where they are concentrated. Visual Quality Defects are grouped together if the distance between the consecutive Visual Quality Defects is equal to or smaller than the defined number of pixels.
To set the Concentration ratio:
To show or hide the grid and regions on the image, use the Show grid and regions check box
Here you can define which reported Visual Quality Defects should be displayed on the Concentration Diagram. You can filter the defects by:
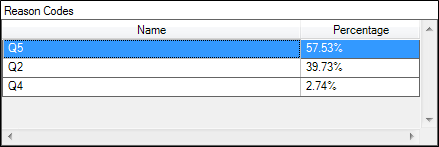
Select the required Reason Code and only the Visual Quality Defects reported against this Reason Code will be included in the displayed Concentration Diagram.
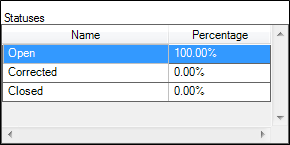
Select the required status and only the Visual Quality Defects reported with this status will be included in the displayed Concentration Diagram.
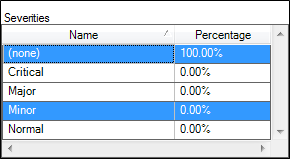
Select the required severity and only the Visual Quality Defects reported with this severity will be included in the displayed Concentration Diagram.
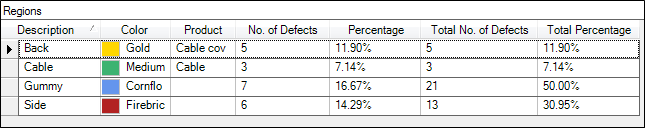
The Regions grid displays a list of regions where the Visual Quality Defects occur along with the number of these occurrences and their percentage.
The defined filter criteria are such that at least one Visual Defect falls into these criteria on any of the images that are displayed for this Concentration Diagram. This means that even if the Visual Defect is displayed on an image different from the image that is currently being viewed, then the grid with that Visual Defect will be displayed. If that Visual Defect is reported outside any of the defined regions, an empty row in the grid will be displayed only on the image that is currently being displayed.
The numbers are calculated for both parent and child images if the Visual Defects are reported against the same Reason Code.
The grid contains the columns shown in the table below.
| Field | Description |
| Description | The localized name of the region as defined in the Document Maintenance. If a Visual Quality Defect was marked outside the regions, then the description is not provided. |
| Color | The color of the region assigned in the Document Maintenance |
| No. of Defects | The number of Visual Quality Defects recorded on the displayed image and occurring in the given region. This value depends on the filter settings. If the filtering options are changed then this value will be recalculated. |
| Product | The Product linked to the region |
| Percentage | The percentage of Visual Quality Defects recorded on the displayed image in relation to all the Visual Quality Defect occurrences selected for calculation in the Concentration Diagram. This value depends on the filter settings. If the filtering options are changed then this value will be recalculated. |
| Total No. of Defects | The number of Visual Quality Defect occurrences reported on all the images of the Product for all Quality Defects selected for the Concentration Diagram and occurring in the region. For example, if there are two images that display the same part of a Product but from different perspectives and each image has the same region defined (e.g., called "bottom"), then all the Visual Quality Defects reported in this region on both images, will be counted in Total No. of Defects. This value depends on the filter settings. If the filtering options are changed then this value will be recalculated. |
| Total Percentage | The percentage of Visual Quality Defect occurrences reported on all the images of the Product in relation to all the Visual Defect occurrences selected for calculation in the Concentration Diagram. This value depends on the filter settings. If the filtering options are changed then this value will be recalculated. |
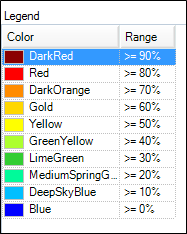
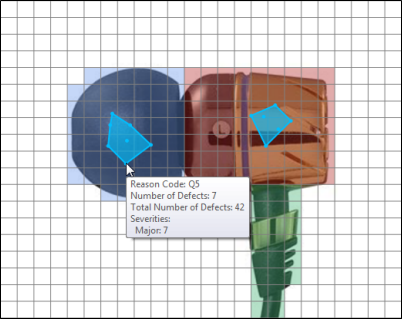
The Legend lists the colors in which the concentrated groups of Visual Quality Defects are displayed on the chosen image. Each color corresponds to a percentage of Visual Quality Defect occurrence in relation to all the Visual Quality Defect occurrences selected for calculation in the Concentration Diagram. The colors can be changed by choosing them from a drop-down menu.
Example: If a concentration group of Visual Quality Defects is displayed in red and the range for this color is >=80%, then it means that this concentration group constitutes 80% of all the Visual Quality Defects that are calculated in the Concentration Diagram.
On the image pane, you can see the Product image, the grid and regions defined for it and the Visual Quality Defect concentration area. Depending on how the defects are grouped, you can see either the individual Visual Quality Defects or their groups. If you point the cursor to a given concentration area, a tooltip will be displayed with the following information:
If you point the cursor at an individual Visual Quality Defect, a tooltip will be displayed with the following information: