
The screen consists of a tree view in the left pane with content appropriate to the item selected in the tree in the right pane.
The tree view can be grouped by KPI Grid, KPI Context, or KPI Category. Initially the tree is loaded with the child nodes collapsed.
The structure of the tree is:
The tree also has an “Unassigned” node to which the KPIs that are not added to a KPI Grid are added. Right-click commands are disabled for this node.
The tree also consists of the All KPI Grids, All KPIs, and All KPI Terms nodes. When one of these nodes is selected, a grid which lists all of the KPI Grids, KPIs, or KPI Terms will be loaded based on the selected node.
The following actions can be performed by right-clicking the node:
| Level |
Action |
|
KPI Grids |
Add New Grid Preview |
|
KPI Grid |
Copy Grid (and linked KPIs) Link KPI |
| Preview | |
| Delete Grid | |
| KPI |
|
|
Copy KPI (Tolerances and Term Association) Preview KPI |
|
| Delete KPI | |
|
KPI Term |
|
|
Copy KPI Term (and Term Association) Delete KPI Term |

The items in the tree can be searched by entering a name in the Find text box and clicking the Prev (previous) or Next button. Pressing the Enter key or F3 key has the same effect as clicking Next, and pressing Shift + Enter or Shift + F3 has the same effect as clicking Prev.
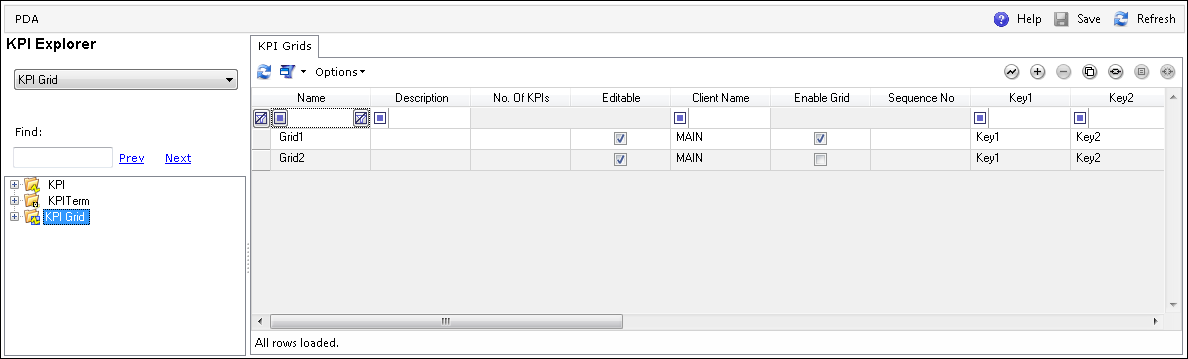
When PDA is loaded, the initial screen shows the list of KPI Grids. The KPI Grid is to define the properties that will be used by the Performance Dashboard in runtime when displaying the KPI values. The Key Column captions and the rate at which the KPI values needs to be refreshed are set in the KPI Grid. The Sequence No property sets the sequence in which these grids are to be loaded.
The KPIs are linked to one or more KPI Grid(s) and this determines the KPI values that are loaded in each grid. The purpose of a KPI Grid is to group different KPIs and display their values in the grid with common settings such as Key Column captions and refresh rate. When a KPI is linked to a grid, it is important that they all have the same meaning for the Key Columns that they use (e.g., if Key1 is meant to display Facility, then all of the linked KPIs should have a Facility value stored in KPI_VALUE.Key1). It is not necessary that all KPIs use all of the Key Columns, but the common columns must be the same for the displayed values to look meaningful. An example set of KPIs linked to a grid would be OEE_Facility, OEE_WorkCenter, and OEE_Resource, with the Key Columns Facility, WorkCenter, and ResourceName.
When a grid is selected on the tree or  (Properties) is clicked, the following screen appears:

The above screen shows the list of KPIs linked to the grid. KPIs can be added or removed using  (Link) and
  (Unlink).
The General properties tab provides a screen for editing the KPI Grid.

| Field | Description |
|
Name |
The grid name that will appear in the bottom portion of the PD Administration. |
|
Description |
The description of the grid. |
|
Column 1 -10 |
The text that is displayed for that column of the grid within the Performance Dashboard. |
|
Sequence |
The sequence in which the grids are displayed on the screen. |
|
Enable Grid |
This flag is set to state that a grid can be displayed. If it is turned off, then the grid (and the KPI values) will not be displayed. |
|
Refresh Rate |
The rate at which the Dashboard is refreshed for that active grid. |