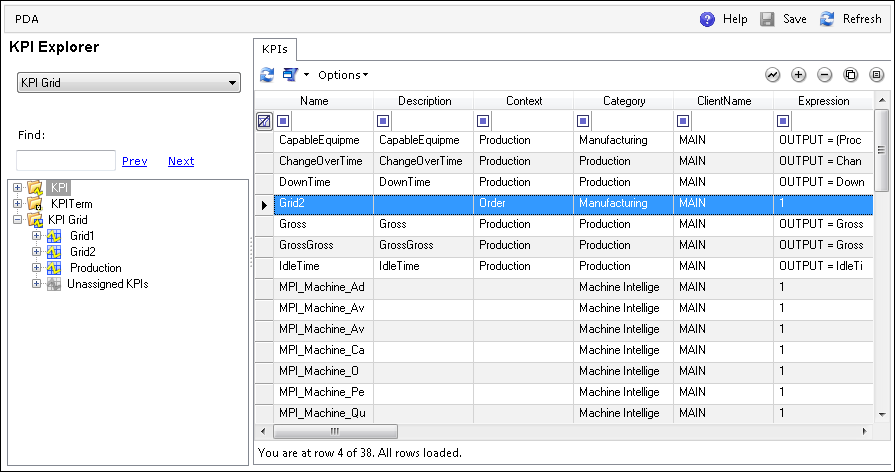
The list of all KPIs can be loaded by selecting the KPI node on the tree.
|
Action |
Description |
|
Preview |
The PD runtime is loaded with the selected KPI. |
|
Add |
Opens the KPI properties screen for adding a KPI. |
|
Delete |
Deletes the selected KPI and the links in the KPI_GRID_KPI table. |
|
Copy |
Copies the KPI, tolerances, and term associations. |
|
Properties |
Opens the KPI properties screen for editing the selected KPI. |
The KPI maintenance screens are loaded by clicking  (Properties) on the KPI list after selecting a KPI or by selecting a KPI on the tree.
The following fields can be set using the KPI details screen.
|
Field |
Description |
|
Name |
The KPI name, which is the primary key used to reference the KPI in both calculation and display. |
|
Client |
Describes who owns the KPI in the system. For more information, see Client as well as the |
|
Description |
The short, medium, and extended description. |
|
Context |
The KPI Context that filters the KPI Terms so that certain terms can be used for calculation. For example, if the production context is used, then only production KPI Terms can be used in calculation. |
|
Category |
A grouping of KPIs. |
|
Design Mode |
When this value is True, no validations are performed when the KPI is saved. This provides the ability to save the KPI without setting all of the required values. A KPI will be calculated only when the Design Mode is False. |
|
KPI Expression |
The mathematical formula used in calculating the KPI. This can be written in Javascript, C#, or VB and can also contain KPI Terms to be used in the calculation. You cannot name KPI Terms to coincide with a keyword used in the coding language. For example, Math.Random() is a valid Javascript line of code, so you cannot have a KPI Term named "Math" or "Random". |
|
Context Query Statement |
The default KPI Context statement to be used for the specified KPI. The default KPI Context statement can be overridden by a KPI Business Component. For more details, see KPI Calculation Process. |
|
Time From Term |
The KPI Term that returns the start/from time for the KPI calculation. |
|
Time To Term |
The KPI Term that returns the end/to time for the KPI calculation. |
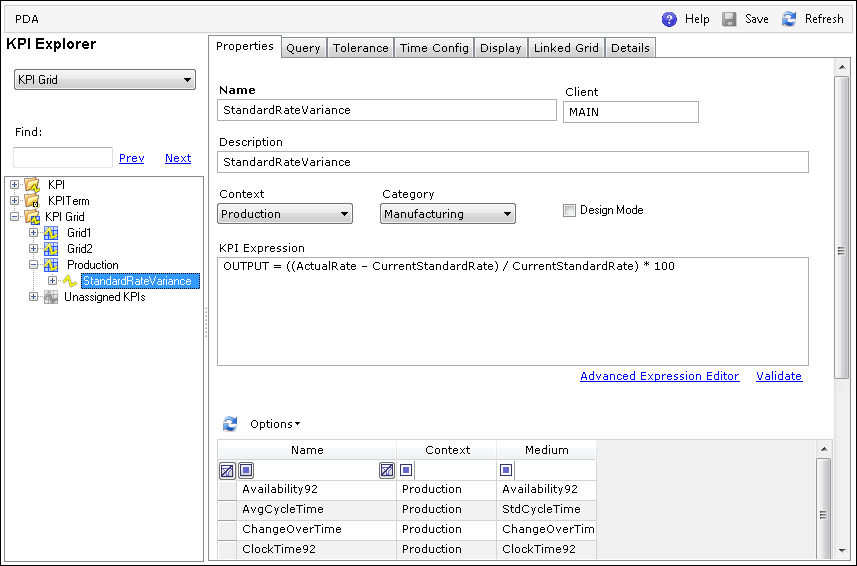
The KPI Expression is defined in the properties tab. The list of terms available based on the KPI Context is shown in the grid, and by double-clicking a row, the term can be copied to the expression. The context is an optional field, and if set, then only terms of the same context or terms with no context can be used.
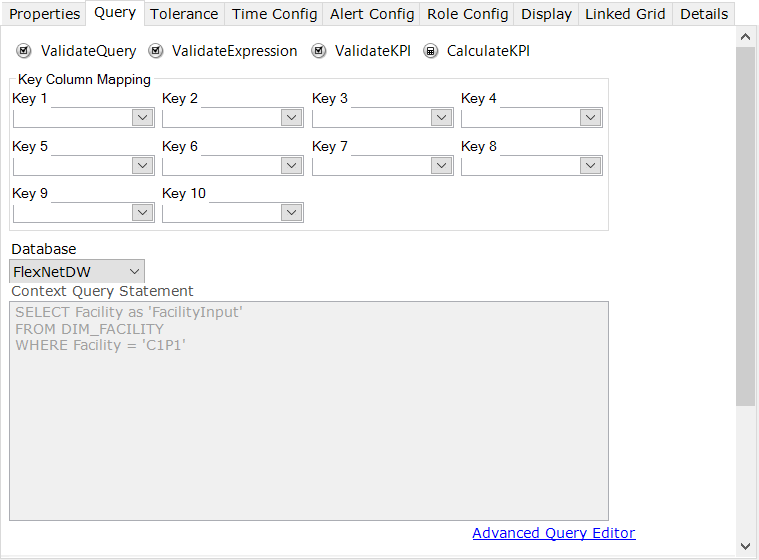
The Key Column Mapping is used to map the context query results and the Key Columns of the KPI value table. In the above example, “Default Facility” will be stored in Key1, “Department” in Key2, etc.
Specifying the key values explicitly in the context query is no longer required as it was in the earlier version. A data warehouse can be used to provide inputs and context.
The result of the query is displayed in the grid in order to provide an idea of the entities for which the KPIs will be calculated.
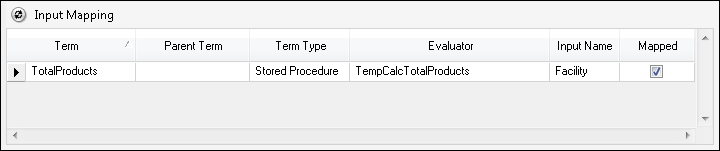
The Input Mapping grid lists all of the inputs required by the KPI Terms. If the input is found in the context query, then Mapped is set to True. Inputs from a KPI Term of type "Script" will not be detected.

|
Button |
Action |
|
Validate Query |
Validates the context query. A pop-up message will show if the query is valid. |
|
Validate Expression |
Validates if the KPI expression is valid. A pop-up message will show if the expression is valid. |
|
Validate KPI |
Validates the KPI configuration. The KPI is calculated but not persisted to determine any configuration issue. |
|
Calculate KPI |
Calculates and stores the KPI values. The KPI should not be in Design Mode for calculation to occur. |
The KPI Tolerance screen is as shown below.
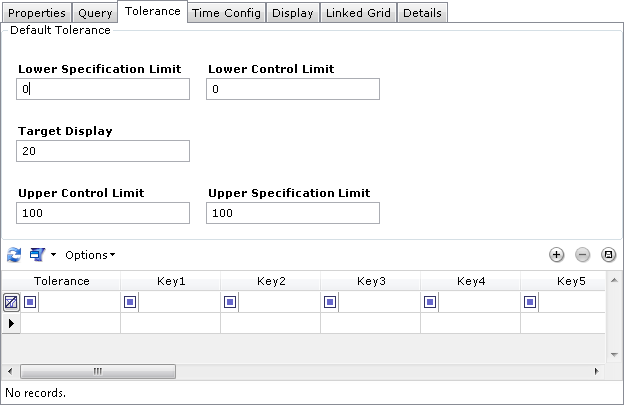
The default and override KPI Tolerance can be configured in the Tolerance tab.
The override tolerance is created or modified using the editable grid. The Key Column headers are changed to the appropriate mapped columns.
These are the properties:
|
Field |
Description |
|
Description |
The description of the tolerance. |
|
Key1 – Key10 |
The KPI Tolerance keys. These are used when performing calculations on the KPI. |
|
Lower Spec Limit |
The lower spec limit for the KPI. Any value recorded lower than this limit is out of the spec and will be displayed as a red indicator on the Dashboard. |
|
Lower Control Limit |
The lower control limit for the KPI. Any value recorded lower than this limit and higher than the out of spec limit is out of control and will be displayed as a yellow indicator on the Dashboard. |
|
Target Value/display |
This is the ideal value of the KPI. |
|
Upper Control Limit |
This is the upper control limit for the KPI. Any value recorded higher than this limit and lower than the out of spec limit is out of control and will be displayed as a yellow indicator on the Dashboard. |
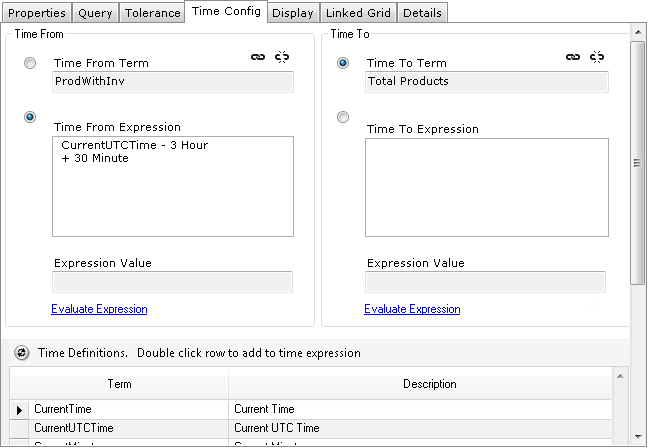
The Time From and Time To values can use KPI Terms or time expressions.
The time expressions consist of time literals, which can be used to specify the time and to add or subtract (days, hours, minutes, etc.) from that in order to set the Time From and Time To values.
The list of available time literals is provided in the grid, and double-clicking a row will add to the input field based on the last input in focus. The Evaluate link will calculate and display the value. This will provide an idea of what the start time and end time values will be when the KPI is calculated. The Evaluate button is useful in order to test and understand the time literals and expressions.
An expression must always start with a time value literal such as CurrentTime, and it must have only one time value literal. The expression can only have an addition or subtraction operator.
|
Time Value |
Literal |
|
Current local time |
CurrentTime |
|
Current UTC Time |
CurrentUTCTime |
|
Current Minute |
CurrentMinute |
|
Current Hour |
CurrentHour |
|
Current Day |
CurrentDay |
|
Current Day End |
CurrentDayEnd |
|
Start of Current Week |
CurrentWeek |
|
End of Current Week |
CurrentWeekEnd |
|
Start of Current Month |
CurrentMonth CM |
|
End of Current Month |
CurrentMonthEnd |
|
Start of Current Year |
CurrentYear CY |
|
End of Current Year |
CurrentYearEnd |
|
Second |
Second |
|
Minute |
Minute |
|
Hour |
Hour |
|
Day |
Day |
|
Month |
Month |
|
Year |
Year |
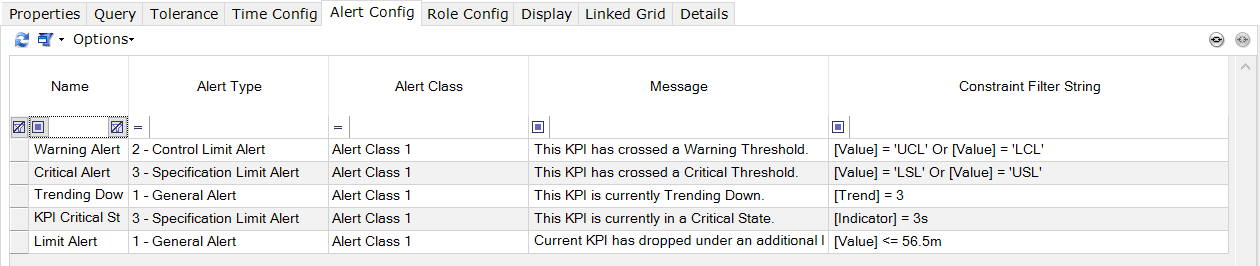
The Alert Configuration tab consists of a grid that allows the assignment of alerts that will be triggered automatically during KPI calculation. Click the link button to display the KPI Alert Rules grid.
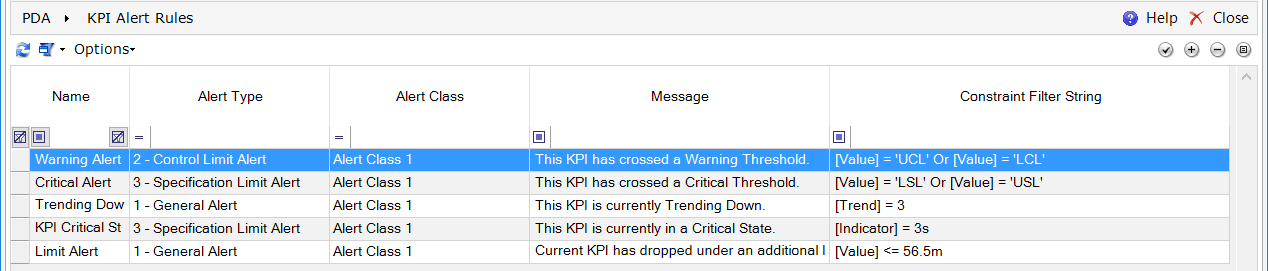
Select an alert and click the properties button to open the KPI Alert Rule screen.
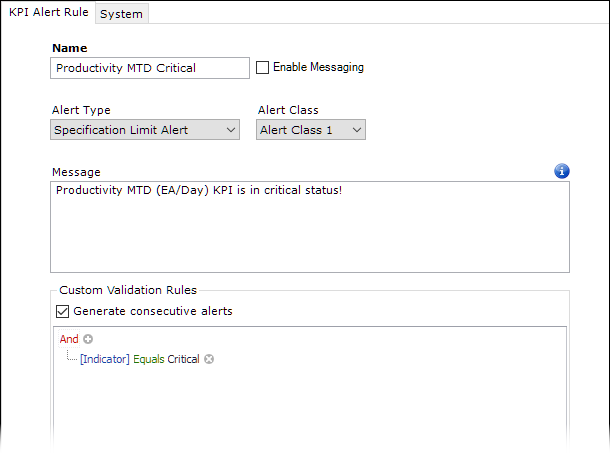
You can define custom parameters in the alert message for the KPI Alert Rule. To see the list of available parameters, hover the cursor above the  icon.
icon.
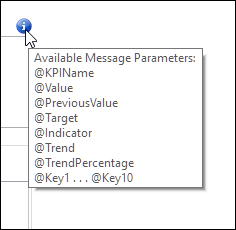
When you add these parameters in the message body, they will be replaced with actual values during run-time calculation of any KPI to which this KPI Alert Rule is attached. This makes it possible to have specific alert messages generated for every individual KPI calculation.
|
Field |
Description |
| Enable Messaging | When enabled, the message will be also sent to the DELMIA Apriso Message Bus broker configured in the system. |
|
Generate consecutive alerts |
Additional alerts are sent even if the previous check generated an alert. |

Click the logical operator (And, Or) to change it or create multi-part formulas. Saving the KPI Alert Rule will simplify the formula as needed.
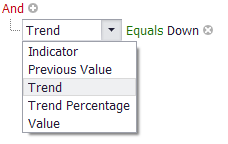
Click the key property to select another property.
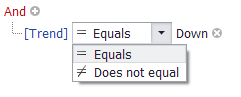
Click the comparator to select another comparator.
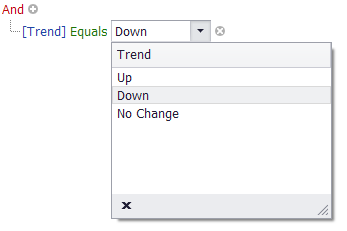
Click the value to enter a different value. The new value will not be entered until focus leaves the value input field.
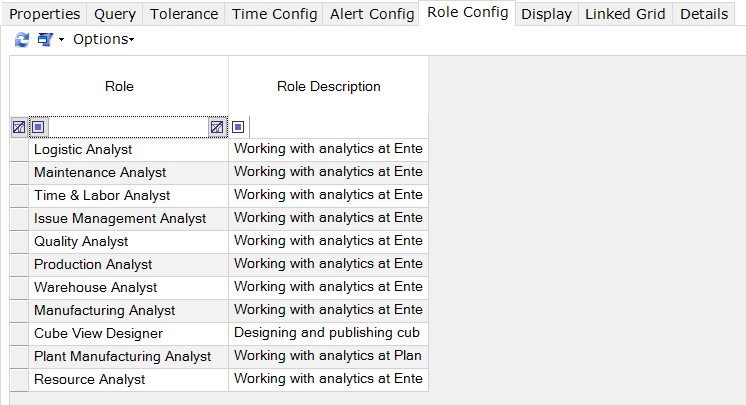
The Role Configuration tab consists of a grid which allows the assignment of roles to the KPI.
The Display tab consists of a grid which will display KPI values when the refresh button is clicked.
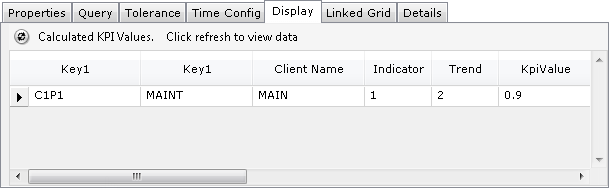
The KPI values are calculated based on the saved configuration and are not persisted. All the required fields must be set and the terms must be correctly configured for the values to be calculated. This provides an idea of the values that will be calculated and helps to identify any errors in the configuration.
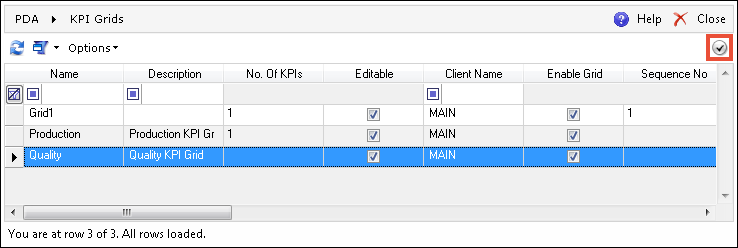
The KPI must be linked to a KPI Grid for the values to be rendered by the Performance Dashboard in runtime.
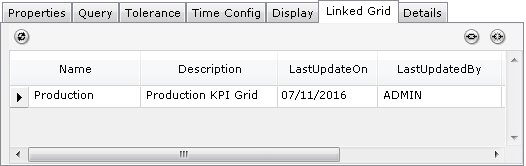
When the link button is clicked, the KPI Grid selection screen is displayed. The grid in which the KPI needs to be displayed can be selected.
This adds a record in the KPI_GRID_ KPI table for the KPI and the KPI Grid. A KPI can be displayed in multiple grids. Clicking  (Unlink) removes the KPI grid link.